Business analytics tools such as dashboards in Excel lead to strategic thinking and smarter business. Sounds good, I’ll take some of that. But what exactly are we talking about? And can I really use my data like that?
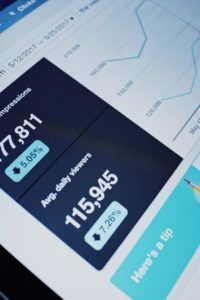
If the growth of your business is important to you, one of the most important things you can do is to unleash the power of your data to show you what is happening, what is changing for better and worse, and what you can do about it. Businesses of every size use custom dashboards to provide graphical insights by organizing the data in ledgers, spreadsheets, databases, and more. Although dashboards can look visually sophisticated when finished, they can be implemented by any business, in the office software you are already using. Here we will take a look at a dashboard and how it helps a company identify an improvement it can make right away. Then I will offer some tips and advice about how you can think about the visualizations that are right for your business, and how you can get started on your own.
Read moreUse Dashboards to Track What Matters

